New Mexico Unemployment Rate Drops But County Rate Tells A Different Story
According to data released by the New Mexico Department of Workforce Solutions, New Mexico’s unemployment rate dropped to 3.4%, a 1.8% drop in unemployment that was also the largest drop in unemployment rates across the fifty states.
New Mexico’s statewide unemployment rate was lower than that of Texas (at 3.6%), but much higher than neighboring states Utah (2.0%), Oklahoma (2.6%), and Colorado (2.8%). This difference in the relative unemployment rates may be factors, in part, of the respective strengths of the economies of each state, the populations of each state, and the average age of the populations of each state.
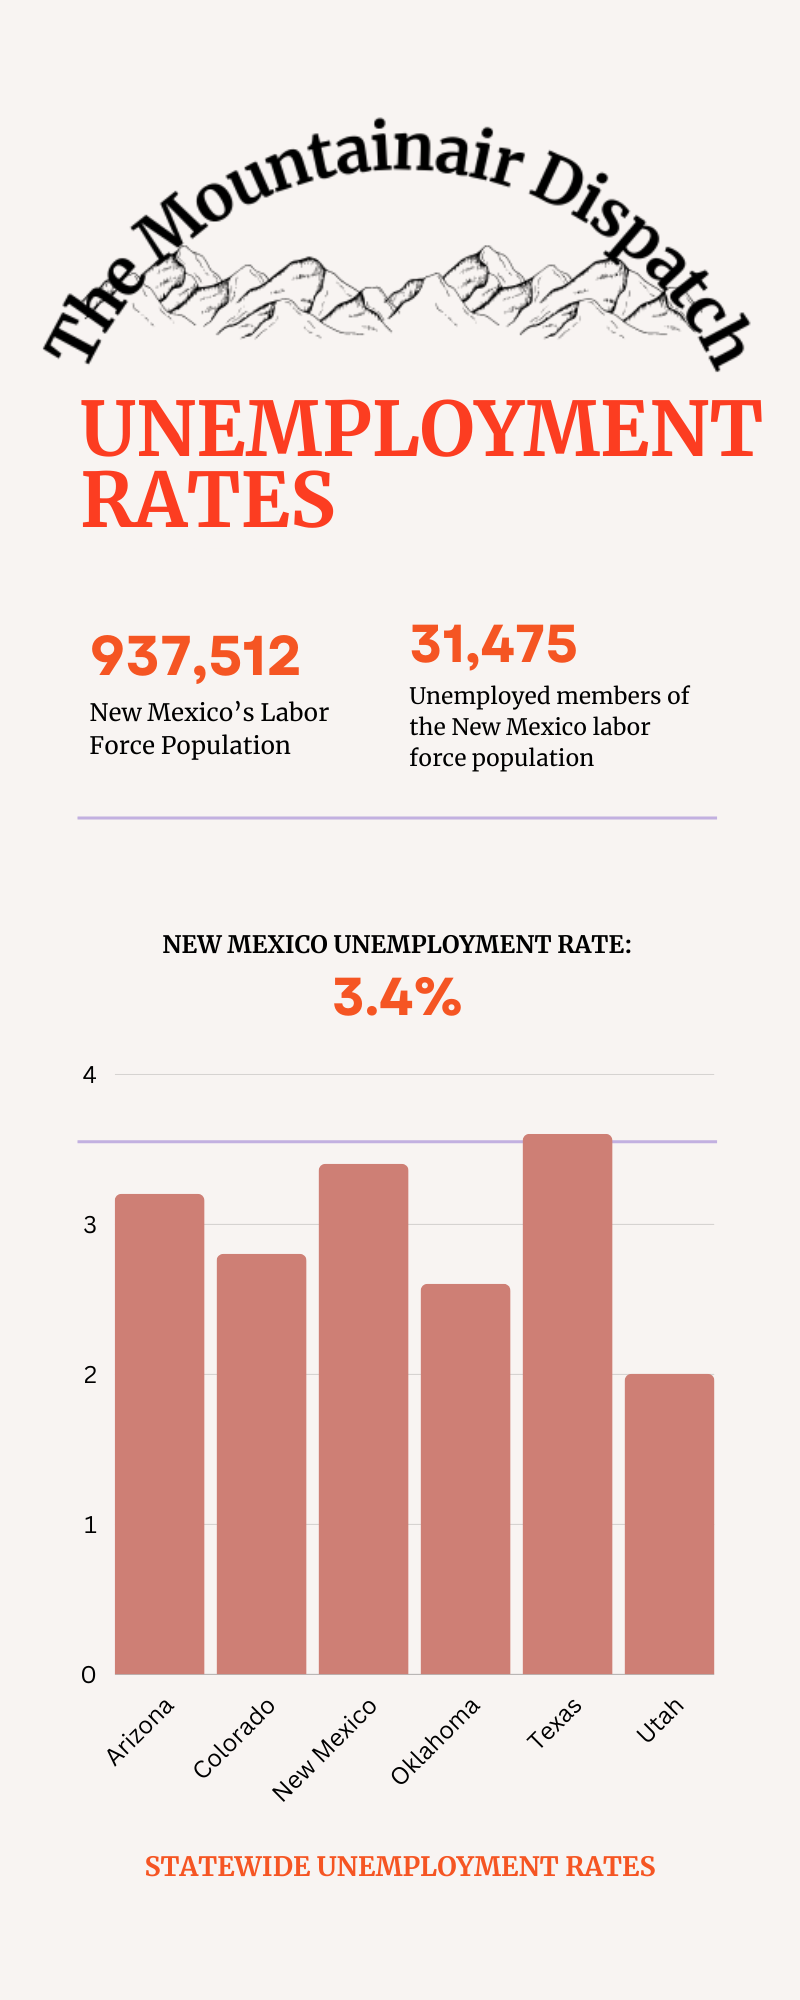
Comparison of Regional Unemployment Rates (December 2022 Data)
- Arizona 3.2%
- Colorado 2.8%
- New Mexico 3.4%
- Oklahoma 2.6%
- Texas 3.6%
- Utah 2.0%
Unemployment Within New Mexico
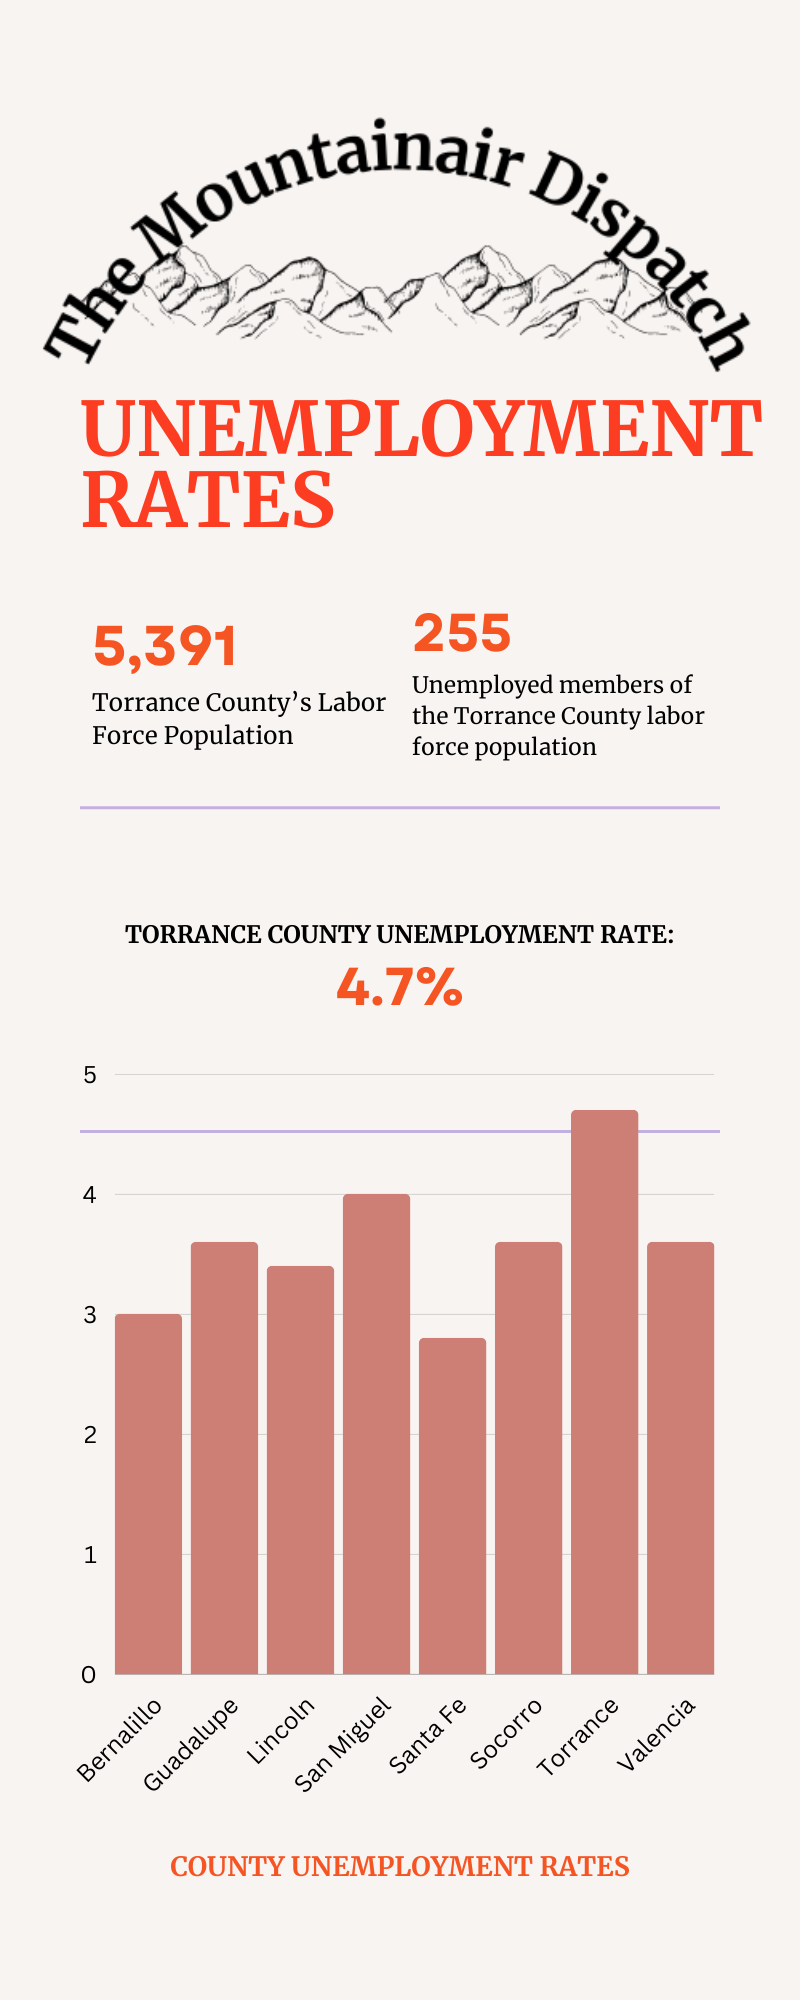
More locally, Torrance County experienced a 1.8% drop in its unemployment rate, down to 4.7%. Unfortunately, Torrance County’s unemployment rate is much higher than its neighbors. (See Comparison of County Unemployment Rates, below.) San Miguel County had the next highest unemployment rate at 4.0%. Santa Fe County had the lowest rate of neighboring counties, with 2.8% unemployment.
There are several factors that can explain why Torrance County’s unemployment rate is substantially higher than that of other counties. First, Torrance County has a smaller workforce than any of the other counties examined except for Guadalupe County (See Comparison of Labor Force Size, below). With a workforce of 5,391, just 255 unemployed personnel have a larger impact in Torrance County than they would in Bernalillo County, Lincoln County, San Miguel County, and Valencia County, which all have substantially higher labor force populations. Second, unemployment rate statistics that follow the US Department of Labor metrics only track unemployment through a sample of the US population known as the Current Population Survey sample, which only tracks 110,000 people nationwide. The US population is obviously much larger than that number. When economists take a sample in that fashion, there are risks that sampling errors will have larger impacts in regions less represented by the sample. (This applies at the state level and at the county level.) Third, the US Department of Labor unemployment calculations are based on the number of those who are unemployed but not those who have been “habitually unemployed” (unemployed for over six months). If a region had a longstanding unemployment problem that lasts for over six months, that region’s number of unemployed labor force members will shrink every six months as unemployed workers become designated as “habitually unemployed.”
While the data in this article is included in the infographics shown above, it is also included in text format for use with adaptive/assistive technologies.
Comparison of County Unemployment Rates
- Bernalillo County 3.0%
- Guadalupe County 3.6%
- Lincoln County 3.4%
- San Miguel County 4.0%
- Santa Fe County 2.8%
- Socorro County 3.6%
- Torrance County 4.7%
- Valencia County 3.6%
Comparison of Labor Force Size
- Bernalillo County 331,434
- Guadalupe County 1,850
- Lincoln County 8,711
- San Miguel County 10,839
- Santa Fe County 72,151
- Socorro County 6,098
- Torrance County 5,391
- Valencia County 30,556
10